


 Many building owners track their building energy usage, and benchmark it against the Energy Star database of commercial buildings through Energy Star Portfolio Manager. If you are not currently doing this, please check our previous blog post here (note: benchmarking is required in the City of Atlanta).
At the end of the process, you end up with an Energy Star score 74/100, maybe an EUI (72), or perhaps a total utility spend of about $645,000 a year.
Often, the next questions are something like, “So what? What do I do with this?”
We would like to help you take these questions, and build actual projects that provide a clear path forward to better operations and lower utility costs.
What’s next after energy reporting?
An Energy Star score can help, but it may not give you enough information to know what level of effort towards energy is worth taking, or how much opportunity you might have.
What might be more helpful is to see how your building’s energy usage compares against your local Atlanta peer buildings. If you own a class A office building in downtown Atlanta, you want compare it to the other class A buildings of similar size that are next door, across the street, in your local market.
McKenney’s has benefited from the opportunity to work with literally thousands of Atlanta commercial buildings, giving great insight to just those kinds of comparisons.
Energy Usage Intensity (EUI, kBtu/SF)
If McKenney’s ran a comparison report for you, you might see this:
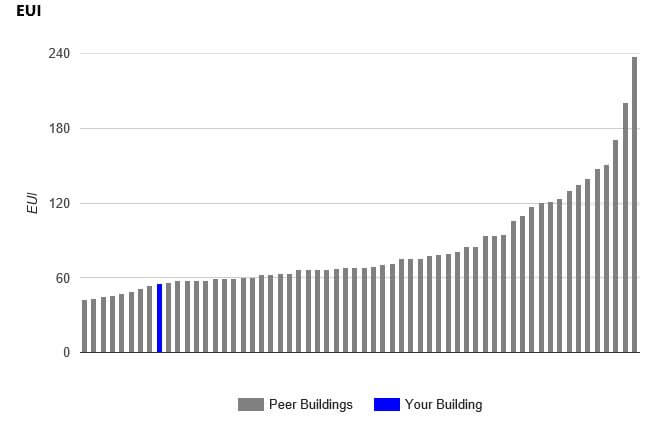
This is comparing your building energy usage per square foot against your local peer buildings. From this view, your performance is rather good, putting you in the upper 25% with the highest performing buildings. There is always room to improve, though, as you are still using 30% more energy than the best building.
Utility Cost per Square Foot
Let’s look at a view that is more pertinent to how your multi-tenant building performance is tracked as an asset, the overall financial impact.
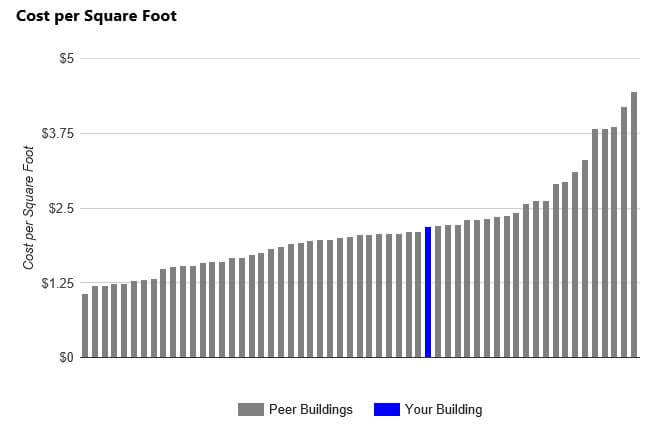
Seeing your building performance from this standpoint, there is a lot of room to improve. It also shows that how and when energy is consumed is as important as the amount that is consumed. Mechanical systems drive most of the “how” energy is consumed in commercial buildings.
If you were at the same rough location on the cost side as on the energy side, you would be spending around $1.50/SF, instead of $2.20. That is a huge swing in costs, and often not easy to see.
Could my building perform better?
Yes, with its current system, and even more so when it’s time to retrofit systems.
Most buildings can operate much more efficiently with their existing systems and controls than they actually do. This is typically referred to as operational improvements. Capital or retrofit projects are those that make significant improvements in the building envelope, systems, and controls, and we will discuss these capital projects in the next blog post.
Going back to the operational improvements, let’s start with an hourly energy simulation, based on your specific building systems, operating schedule, and other characteristics. This gives us a “Predicted” kWh of electrical usage that we would expect to see. Then, we overlay the actual electrical usage on top of that to do a comparison.
Predicted vs Actual
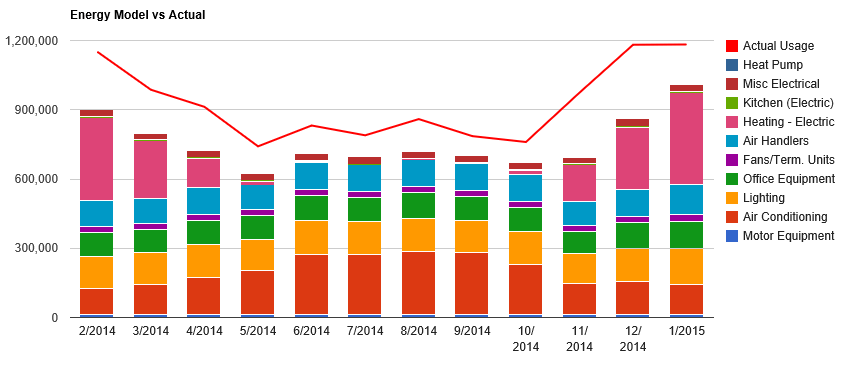
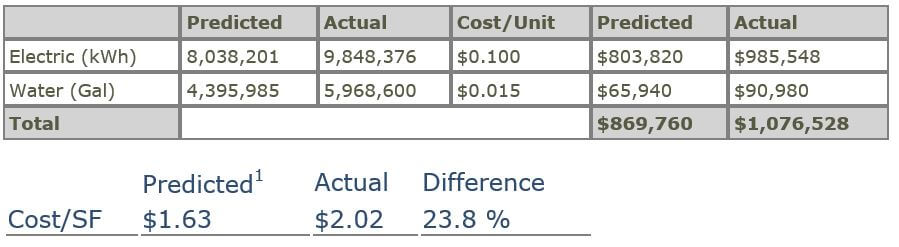
As you can see, there is a fairly significant gap between what’s predicted vs what is actually happening, often to the tune of 20-25%. That’s a big opportunity.
What makes up that difference? Lots of things. Buildings are complex operations, with thousands of moving parts, which is part of the reason why they can get out of tune. For the HVAC systems, it’s everything from bad actuators scattered in the 400+ terminal units to a 400 ton chiller trying to deal with excess chilled water flow.
Our goal is to comprehensively identify the issues, correct them, and recapture that lost efficiency, often through a retro-commissioning project. Not only do you end up with a building that costs less to run, it is often more comfortable, and has less nagging issues that you have to spend the time to deal with.
If you are spending $0.30 a foot more than you need to on utilities ($105,000 annually on a 350,000 SF building), isn’t there something better those funds could be used for? We think so, and we’d like to help you get there.
In our next post, we will walk through how to get take your newly tuned building, and build a capital project plan that shows where your building performance could be in the next 5 years.
Have a question for our experts? Leave a comment below and check out our website for more information.
One Comment on “Moving from building benchmarking to building projects”
Great article.